

Financial and market websites publish instrument prices, company information, historical values, financial metrics and corporate information, and each source presents them in its own format. A single page may combine a quoted price, a trading volume, a reporting period and a corporate announcement.
The same instrument can also appear on several sources, with differences in symbols, currencies, formats or timestamps. Structured financial datasets built from more than one source may therefore need normalization and matching, so that each instrument is recorded once and its values remain comparable.
Financial & Market Data Collection
Financial and market data is relevant to organizations that need a structured view of publicly displayed market information, including:
- Financial researchers working with market and company data
- Equity and stock researchers
- Market researchers
- Analysts comparing instruments, sectors or regions
- Organizations building financial datasets
- Teams researching sectors and regional markets
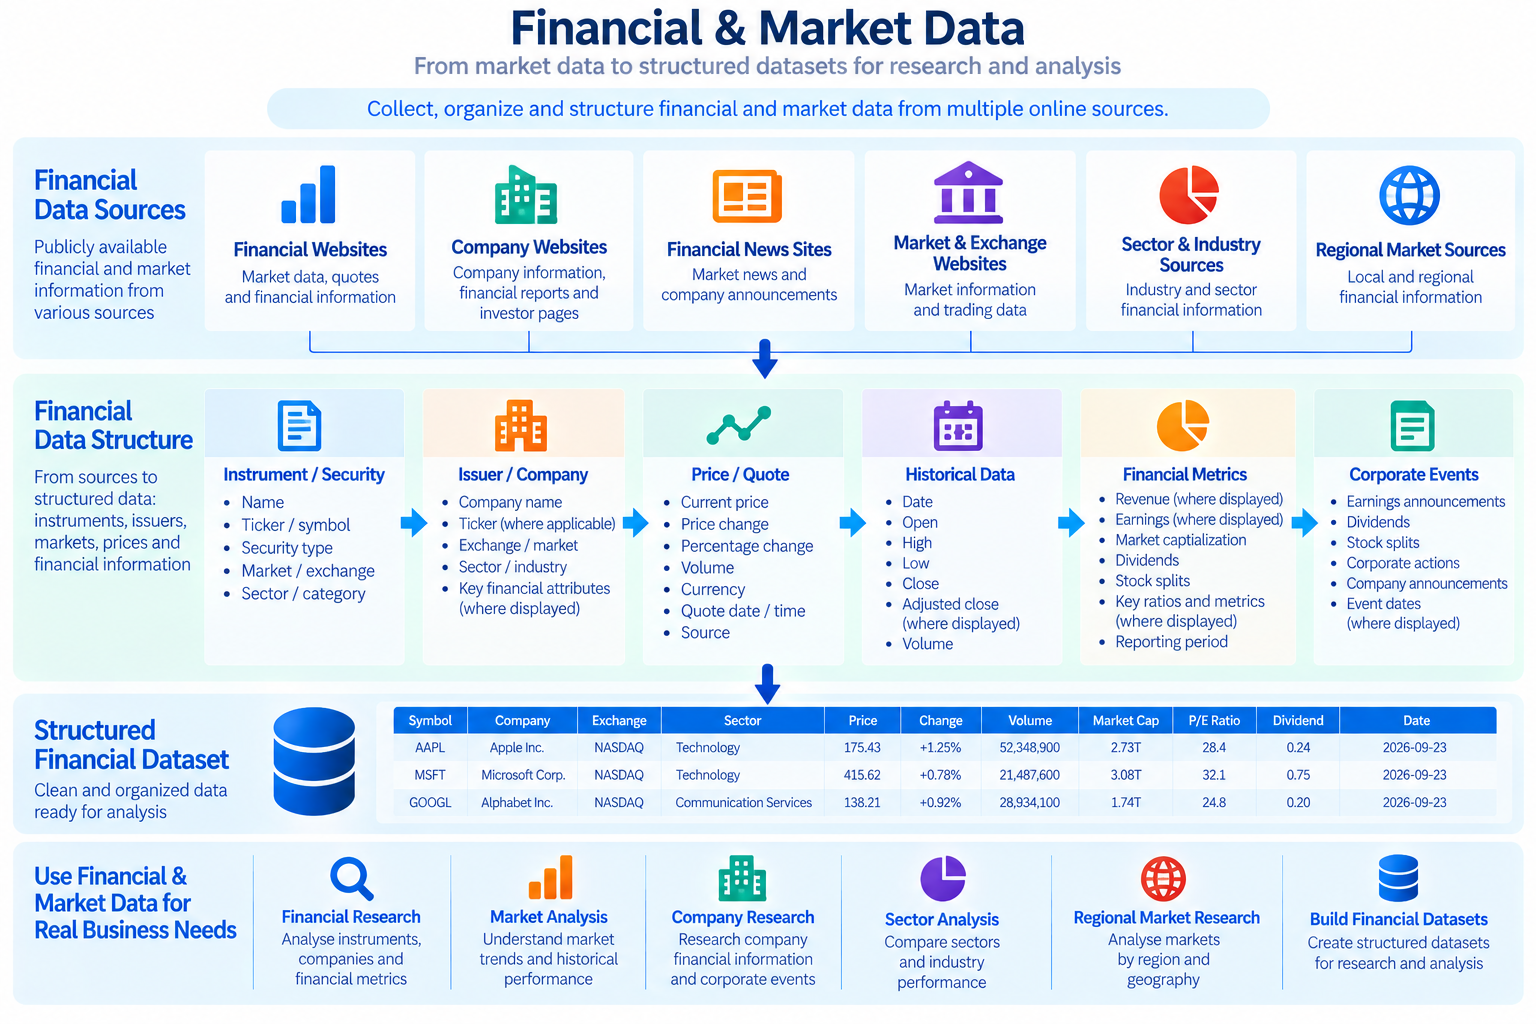
Financial and market data has a structure of its own. The instrument or security is the central object, carrying a name, a symbol, an exchange and a type. It is linked to an issuer, and its values are observations: a displayed price is tied to a point in time, a historical series is a set of dated observations, and financial metrics and corporate events are tied to reporting periods or event dates. Sources also differ in what they display, so fields such as volume, adjusted close or market capitalization exist only where a source shows them.
How Financial & Market Data Is Organized
Financial data is easier to work with when it is clear how records relate to each other. The instrument or security is the primary record, and issuer details, prices, history and events attach to it. Deciding what each record in a dataset represents is one of the first choices in a financial data project.
Instruments, Securities & Issuers
An instrument or security is the primary market-data object. Depending on the source, it appears with an instrument name, a ticker or symbol where displayed, the exchange or market it is listed on, and a security or asset type where displayed. Depending on the project and on what a source publicly displays, this can cover stocks and equities, ETFs and funds, indices, bonds, currencies, commodities and cryptocurrencies.
Each instrument is linked to an issuer, the company behind it. Issuer-level information stays at entity level: the issuer’s name and its financial attributes, such as reported metrics and reporting periods, rather than a full company profile.
The same instrument can appear on several sources under different symbol formats, names or currencies. When a project draws on more than one source, matching and normalization decide whether two records describe the same instrument. The fields available for matching depend on what each source displays.
Prices, Quotes & Historical Series
A displayed market price is a point-in-time observation. It is what a source showed at a particular moment, and it is not live market data unless the source itself provides it. A quote can include the displayed price, the price change, the percentage change and the volume where displayed, together with the currency and the quote date and time where displayed. Where available, a collection timestamp records when the value was collected, and the source URL or another source identifier records where it came from.
A historical series is a set of dated observations for an instrument: open, high, low and close, adjusted close where a source displays it, and historical volume, each with its currency.
Markets, Sectors & Regions
Instruments are organized by the exchange or market on which they are listed, and sources often group them by sector or category as well. Where publicly displayed, this makes it possible to organize a dataset by market, market category, sector and country or region, and to look at geographic differences in displayed market data.
Sector and category labels vary between sources, so they may need to be aligned when data comes from more than one source.
Financial Metrics & Corporate Events
Issuers publish financial information in reporting periods. Where publicly displayed, this can include financial metrics, revenue, earnings and market capitalization, together with the reporting period each value refers to.
Corporate events add dated information to an instrument or issuer, such as dividends, stock splits and company announcements. Announcements are limited to public company announcements and events that are relevant to the financial dataset.
Types of Financial & Market Data
The data types below reflect what financial and market sources commonly display. Which of them apply depends on the project and on what each selected source publicly shows.
Market Price & Quote Data
Market price and quote data describes an instrument as a source displays it at collection time. It may include:
- The instrument or security
- The ticker or symbol, where displayed
- The exchange or market
- The displayed price
- The price change and percentage change
- The volume, where displayed
- The currency
- The quote date and time, where displayed
- The source
Company & Financial Data (Issuer-Level)
Issuer-level data is limited to the entity behind an instrument and its financial attributes. Where publicly displayed, it may include:
- The issuer or company name
- The ticker or symbol, where applicable
- The exchange or market
- Financial metrics
- Revenue and earnings
- The reporting period
- Market capitalization
- Other publicly displayed financial attributes
It supports the instrument record and is not a company profile.
Historical Market Data
Historical data is collected where a source publicly provides it. It may include:
- The historical date
- Open, high, low and close
- Adjusted close, where displayed
- Historical volume
- The currency
- The source
- The date range covered
The history available and its date range depend on the source, and continuous history is not assumed.
Dividends, Earnings & Corporate Events
Where publicly displayed, corporate information can include:
- Dividends
- Earnings and the reporting periods they refer to
- Stock splits
- Corporate actions and events
- Company announcements
- Event dates
This information is at the level of the issuer and does not extend to individuals.
Economic & Market Indicators
Some sources also publish economic and market indicators. Where publicly displayed, and depending on the source, the data can include:
- The indicator name
- The value
- The unit
- The date or period
- The country or region
- The change, where displayed
- The category
Indicators are collected as the source displays them and provide market context alongside the instrument and issuer data.
Financial & Market Data Sources
Financial and market data can come from a range of publicly accessible source types, including:
- Financial websites
- Market information platforms
- Company websites
- Company reporting and investor information pages, where publicly available
- Financial news and market information websites
- Regional market websites
- Sector or industry financial websites
- Other publicly accessible financial sources specified for the project
Source availability and permitted use depend on the source. Not every source type applies to every project, and the same kind of source can present the same instrument differently from one website to another.
Financial & Market Data Use Cases
Financial and market data projects usually start from a research question about instruments, issuers, markets or sectors. The data describes what the selected sources publicly displayed at the time of collection.
Financial & Equity Research
Building structured datasets of selected instruments and their issuers for research: instrument-level and issuer-level financial information, publicly displayed market information, and historical market analysis.
Historical Market Research
Working with dated observations for defined periods: historical prices, historical volume where displayed, and comparisons of prices or market values across periods. Point-in-time datasets support research into how displayed values stood at a given date and describe past observations only.
Company & Financial Research
Researching issuer-level financial information across reporting periods: revenue, earnings, dividends and corporate events. The focus is on the financial attributes of the issuer as they relate to its instruments, not on general company profiles.
Sector & Regional Market Research
Comparing instruments by sector, category, market and region, and looking at geographic differences in publicly displayed financial and market data. Results describe the data collected from the selected sources.
Financial & Market Data Requirements
Financial data projects are defined around the instruments, the markets and the record that each row should represent. The main points to settle are:
- Source websites and platforms
- Instruments or securities in scope
- Asset or security type, where displayed
- Issuer scope
- Exchange or market
- Sector or category
- Geographic or market region
- Record level: instrument, price observation, issuer or corporate event
- Required fields
- Date range
- Quote date and time, where displayed
- Collection timestamp, where available
- Historical values, current displayed values, or both
- Adjusted or unadjusted values, where displayed
- Currency
- Matching and normalization requirements
- One-time or recurring collection
Personal financial information, account information and private investor information are outside the scope. Private investment portfolios and personal contact information are also outside the scope.
The data is collected for research and analysis and is not investment advice. Financial values reflect what a source publicly displayed at the time of collection and should not be treated as live, complete or guaranteed market information.
One-Time and Recurring Financial & Market Data
A one-time collection captures selected values at a single point and can support:
- Financial and equity research
- Historical market research
- Company financial research
- Sector research
- Regional market research
- Financial dataset and database creation
- Corporate-event research
Recurring collection repeats the same sources and fields as timestamped snapshots of publicly displayed values and events, so that changes in the collected data can be compared over time. Snapshots can include:
- Updated prices, where displayed
- Updated financial metrics
- New earnings information
- Dividend information
- Stock splits
- Corporate announcements
- Changes to displayed instrument or company information
- Updated market indicators
How often data is collected depends on the project and on how often the selected sources change. Each snapshot reflects only what a source displayed when it was collected.
Define Your Financial & Market Data Requirement
A clear requirement makes it easier to choose the right sources and record structure for a financial dataset. It helps to outline:
- Source websites and platforms
- Instruments or securities
- Issuers
- Markets or exchanges
- Sectors or categories
- Regions
- Record level
- Required fields
- Historical or current scope
- Date range
- Quote or observation timing
- Currency
- Matching and normalization
- One-time or recurring collection
Once these requirements are defined, we can review the project scope and confirm an approach.